Categories
Data Visualization
A collection of tools for creating various charts.
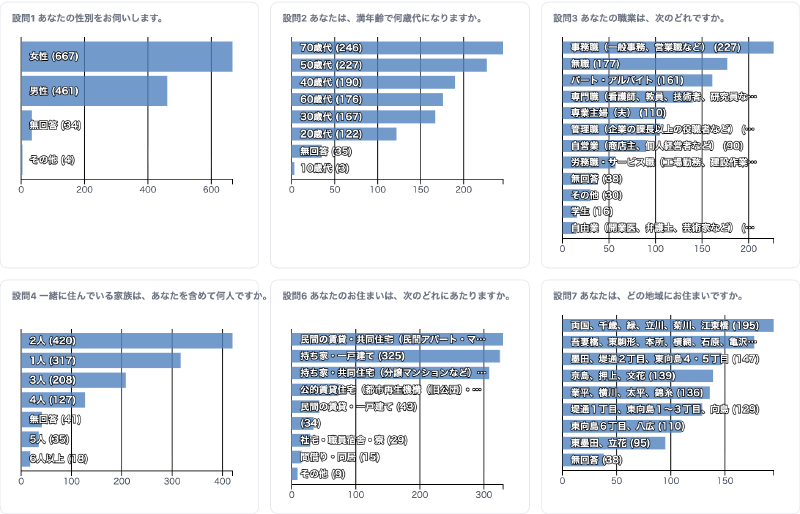
Bar Chart Cross-Filter
An interactive cross-filter dashboard that links multiple bar charts for intuitive data exploration
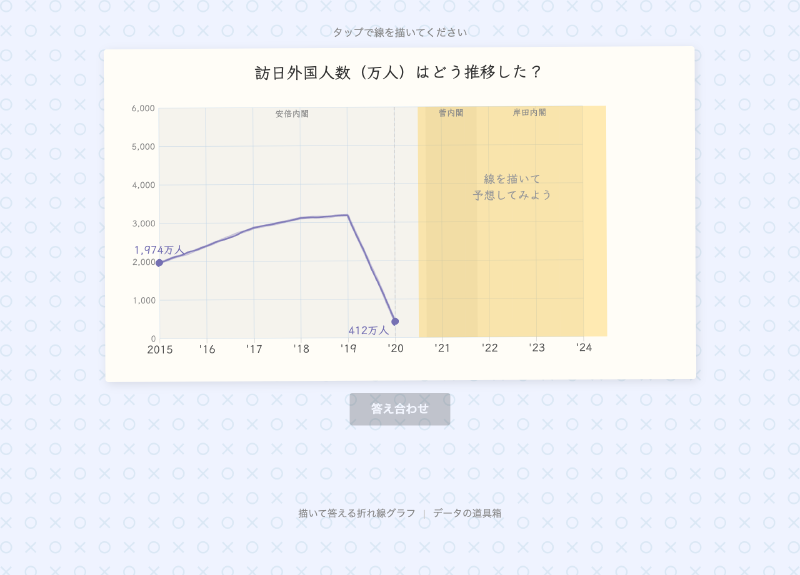
Draw-to-Answer Line Chart
An interactive quiz tool where you predict time-series trends by drawing on a line chart

RAWGraphs2
Create diverse charts with ease

Sankeymatic
Create Sankey diagrams with ease
Cytoscape
Web version of Cytoscape
Data Illustrator
Create diverse charts with ease

Gephi Lite
Create network graphs with ease
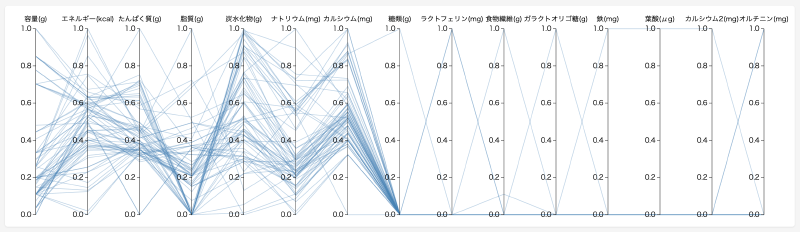
Parallel Coordinates
An interactive chart specialized for comparing and exploring multidimensional data
Vega Editor
Write visualization specs in JSON to render interactive graphs and charts in real time
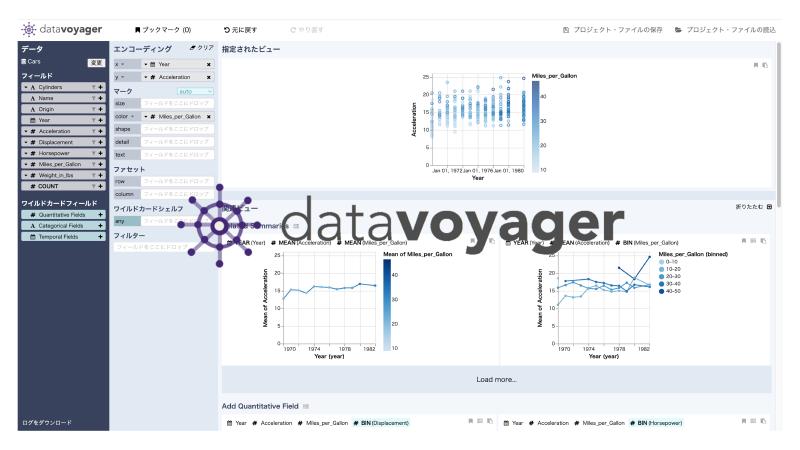
Voyager2
A visualization tool for Exploratory Data Analysis (EDA)

Word Cloud
Word cloud tool optimized for Japanese text