What is this tool?
A browser-based implementation of Cytoscape, which is popular as a desktop application.
It is a tool for interactively visualizing network (graph) data in your browser. You can load relationship data composed of nodes (points) and edges (lines), and intuitively change layouts, apply styling based on attributes, and more.
Cytoscape is an open-source platform for visualizing and analyzing network (graph) data. Originally developed for visualizing and analyzing biological networks (molecular interaction networks), it is also widely used for social network analysis and general complex network visualization.
Features
- Data Import — Upload and visualize files in GEXF, GraphML, and CSV formats
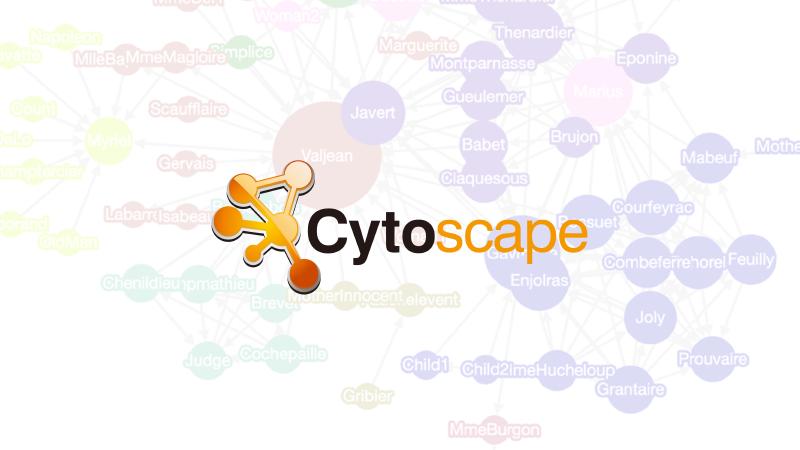
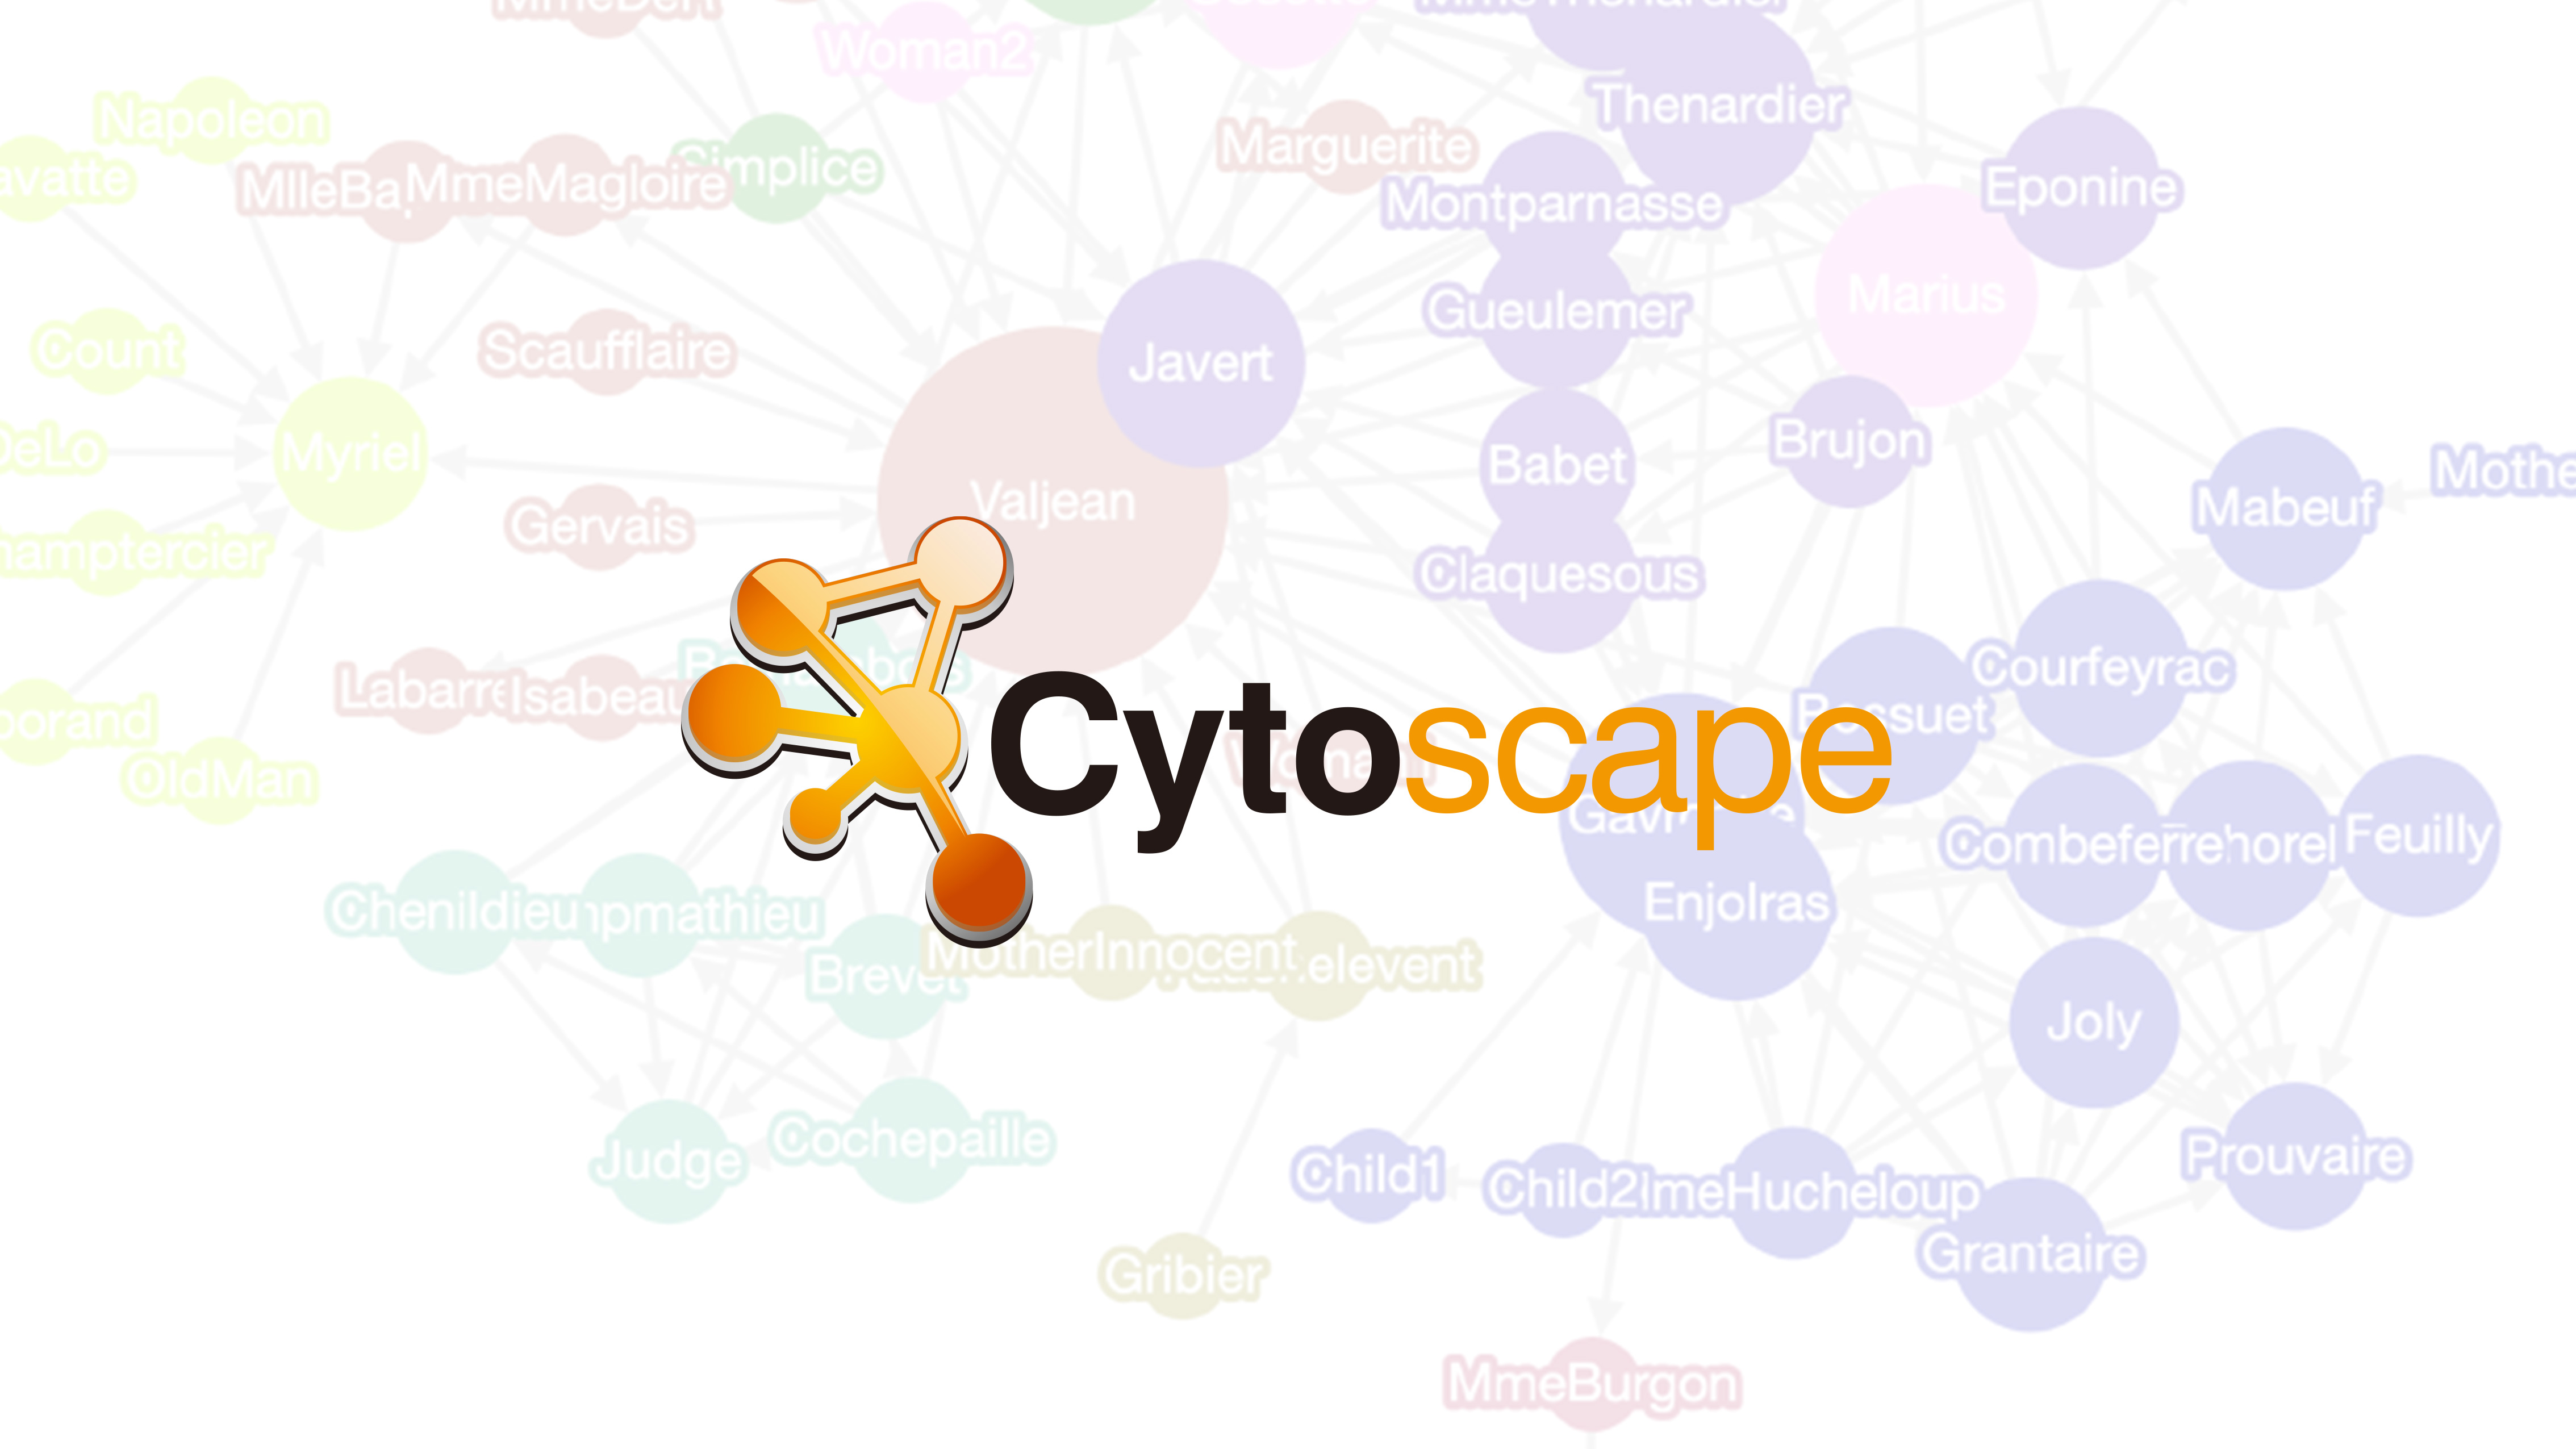
- Sample Datasets — Load one of 9 sample datasets with a single click, including Les Misérables, Game of Thrones, and Marvel Universe
- Layout Switching — 6 layout types: Grid, Circle, Concentric, Breadthfirst, Cose (physics simulation), and Random
- Node Styling — Dynamically change colors (qualitative color scheme), sizes, and labels based on attributes
- Edge Styling — Dynamically change colors (quantitative color scheme), thickness, and labels based on attributes
- SVG Export — Download the current graph in SVG format
- Project Save/Load — Save projects to the server and restore them later
How to use
- Select a file from the “Load Data File” button, or choose from “Load Sample Data”
- Adjust the graph arrangement by changing the layout and easing in the control panel
- Select the attribute to use for node color, size, and label from the dropdowns in the “Node” row
- Select the attribute to use for edge color, thickness, and label from the dropdowns in the “Edge” row
- If needed, save as an SVG image using “Export”
Data formats
GEXF / GraphML
XML formats designed for graphs. They can richly describe node and edge attributes (categories, weights, coordinates, etc.). They can be exported from many tools such as Gephi and NetworkX.
CSV (Edge List Format)
A format that can be easily created from spreadsheets or Excel.
- A header row is required
- Specify the endpoints of edges using
sourceandtargetcolumns (orfromandto) — case-insensitive - All other columns are imported as edge attributes
- Nodes are automatically generated from the edge information
source,target,weight,type
Alice,Bob,1.0,friends
Bob,Carol,2.5,colleagues
Alice,Dave,0.8,family